Welcome to the Kernel Recipes Liveblog !
This is the 8th edition of kernel-recipes, and the second year with an official liveblog.
ftrace: Where modifying a running kernel all started — Steven Rostedt
ftrace is a tracer built into the kernel. It has multiple tracers, to trace functions, function graphs, etc. It supports many types of filters. Steven says that in addition to be the first framework to modify the runtime kernel, it was also the first to add glob filters inside the kernel.
To do modifications, ftrace relies on gcc’s mcount profiler option (-pg). Instead of calling mcount, a trampoline calls into ftrace C code. For x86, it has since moved to “-pg -mentry” to remove the requirement for frame pointers.
When doing the initial tests, with every function being profiled and calling an empty function, Steven found that the initial overhead was pretty big (13%). This lead to changing the build-time code to parse the ELF object files and finding each __fentry__. Then, with linker magic, adding magic variables to find each function start. At boot time, the kernel code will walk over the array of references, and replace every function entry trampoline with nops.
The ftrace overhead per function (struct dyn_ftrace) is about 64 bits, which takes 640kB of memory on Fedora 29.
One of this issue when modifying instructions at runtime is that it might work against the way the CPU fetches the code, caches it, etc. It took some time for Steve to find a proper solution: ftrace is now using breakpoints, and waiting for them to fire before modifying the entry instruction.
The ftrace_caller trampoline is used when there might be multiple functions that want a callback on given function entry, which are discovered at runtime; this can add some overhead. That’s why the dynamic_trampoline was added for when there’s only one caller, and it’s hardcoded inside the trampoline. But the dynamic_trampoline caused complex issues with preemption; which is why the rcu_tasks was added by Paul E. McKenney in 3.18; which was then used by dyn_ftrace in 4.12.
Live patching also uses ftrace, with a small modification: instead of calling back into the original function, when the ftrace handler returns, it goes to the new patched function.
Analyzing changes to the binary interface exposed by the Kernel to its modules — Dodji Seketeli, Jessica Yu and Matthias Männich
The kernel ABI (kABI) is the low level binary interface between the kernel and its modules. It contains the set of exported symbols, their version, data structure layouts, etc.
In the upstream code, modversions/genksyms is the tools used to generate a view of the kernel ABI. Jessica says modversions is imperfect, and can easily trigger false positives of kABI breakages. That’s because the output format is in text mode, and even identical definitions at the binary level might cause crc changes if the text definition varies a bit (for example, a comma instead of semi-colon in struct field separation). libabigail, the tool Jessica and her team are developing, does not have this type of issues since it works directly at the binary level.
Distributions usually want to do ABI tracking for just a subset of the exported symbols. They want human readable kABI reports, runtime ABI checks, and not have a too big impact on build time.
Libabigail, Dodji says, is a framework to analyze ABI by looking at binaries directly. It’s a library that reads ELF and DWARF information, and builds an internal representation of ABI artifacts (functions, variables, types, ELF symbols). There a few specific tools built on top of libabigail.
The kernel has specific symbol tables, which needs specific support in libabigail: __ksymtab, __ksymtab_gpl. In addition, the kernel is very big, with thousands of modles, and hundreds of thousands of types (after deduplication).
There are multiple types of changes detected by libabigail: enum member sorting (changes the value of definitions); adding a struct member (changes the size of the structure, and order). Even small changes that don’t break the kABI are detected (but filtered out by default) : for example, if a struct member name changed.
If a type of a struct member changes, but not its memory layout, it’s also detected.
In Android, there’s an exploration to use a generic kernel image, with separation from the vendor bits, like it was done in userspace (Treble). Matthias is working on that, and using libabigail. This work is limited to LTS releases only; the goal is to have a single kernel configuration for all vendors, a single toolchain, and a limited subset of ABI scope.
libabigail is being integrated into the Android Kernel Build, with tooling to give generate an ABI report. This is also integrated into the Gerrit system to have the report at the time of patch submission to catch changes before they’re even merged. libabigail ABI representation is output into XML files, which can be used by many tools.
An example of unhandled case is an untagged enum: when enum values are used by a function, but the type (for example an unsigned long flags set) is not of the enum type. Another example, would be if such values are in #defines instead.
BPF at Facebook — Alexei Starovoitov
Alexei sent the first BPF patch a few years ago. He then joined facebook later to get more experience on using BPF at scale. Facebook has an upstream-first kernel policy for its datacenters, with close to zero patches being used (except those being tested before upstream submission).
Alexei reiterated the important Linux ABI rule: do not break userspace, even by modifying perceived behavior.
On a given laptop machine, running ls -la /proc/*/fd | grep bpf-prog | wc -l to count BPF programs would show already 6 being used at given time. It is widely deployed. At Facebook, they already have about 40 BPF programs being loaded at a given time on a server, with peaks at 100 for short period of time.
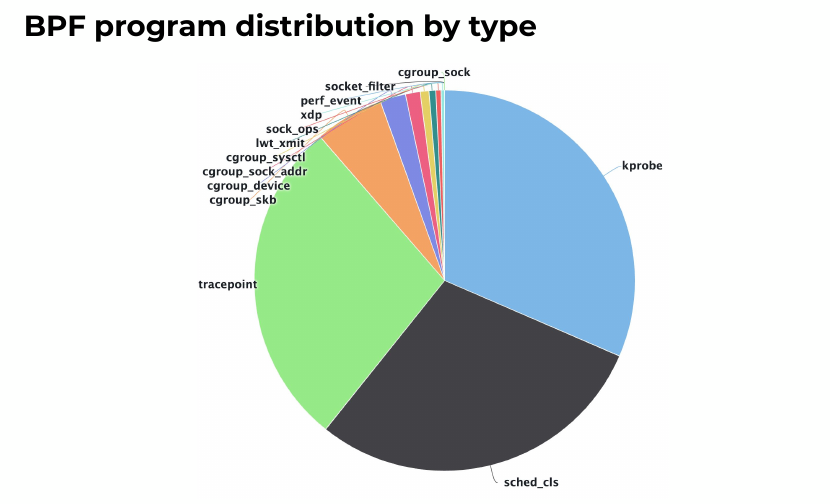
Alexei says that quite often, people point to BPF as a culprit when an issue happens. He gave a first example, with a daemon that did network capture and used BPF. It caused a 1% CPU regression, which was thought to be because of BPF. Doing tests without BPF and with nflog capture instead showed similar CPU usage, so it was easy to show BPF was not at fault.

In another example, a performance regression was caused when using a BPF tracepoint. But it was really at the kprobe setup time (before BPF program loading) that the regression happened.
The last problem was an example of another investigation which led to something completely unrelated. But the BPF tools were very useful to find the root cause (priority inheritance coupled with mm semaphone).
When using BPF in development, the BPF program will be built at runtime. This is the same on production servers; but BCC embeds LLVM, which has a big memory (.text) usage at rest, and even bigger at compile time. This led Alexei to work on a way to compile the program once and then reuse the artifacts on all server. That’s why the BTF format was created to make sure the program did not need kernel headers to work. The BTF format embeds types, relocations, and some source code. It required work to add new clang/llvm builtins, which were upstreamed, too.
The BPF verifier improved a lot in 2019: bounded loops were added after two years of work. The bpf_spin_lock was added, which proves that no deadlock can happen. Alexei that the BPF verifier is even smarter than LLVM: it finds dead code even after llvm -O2, for example. Alexei says he is blown away this happens, even after a few years of being a compiler developer.
The verifier 2.0 can now be even smarter since it has in-kernel BTF information to use, and does not need to rely just on analyzing assembly code. BPF verifier does not trust userspace hints by default, and with the new BTF information, the dataflow analysis possiblities are on an entirely new level. A lot of hand-written and error-prone code in the verifier to validate particular BPF program types will be removable once the BTF option is enabled in the Linux kernel.
That’s it for the morning talks! Continue with the afternoon talks.

Trackbacks/Pingbacks